windpowerlib.power_output.p_curve_density_corr
-
windpowerlib.power_output.p_curve_density_corr(v_wind, rho_hub, p_values)[source]¶ Calculates the turbine power output using a density corrected power curve.
This function is carried out when the parameter power_output_model of an instance of the
Modelchainclass is ‘p_values’ and the parameter density_corr is True.Parameters: - v_wind (pandas.Series or array) – Wind speed time series at hub height in m/s.
- rho_hub (pandas.Series or array) – Density of air at hub height in kg/m³.
- p_values (pandas.DataFrame) – Power curve of the wind turbine. The indices are the corresponding wind speeds of the power curve, the power values containing column is called ‘P’.
Returns: power_output – Electrical power output of the wind turbine in W.
Return type: pandas.Series
Notes
The following equation is used for the wind speed at site [1], [2], [3]:
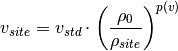
- with:
v: wind speed [m/s],
 : density [kg/m³]
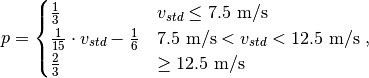
 is the standard wind speed in the power curve
(,
is the standard wind speed in the power curve
(,  ).
).
 is the density corrected wind speed for the power curve
(, ).
is the density corrected wind speed for the power curve
(, ).It is assumed that the power output for wind speeds above the maximum wind speed given in the power curve is zero.
References
[1] Svenningsen, L.: “Power Curve Air Density Correction And Other Power Curve Options in WindPRO”. 1st edition, Aalborg, EMD International A/S , 2010, p. 4 [2] Svenningsen, L.: “Proposal of an Improved Power Curve Correction”. EMD International A/S , 2010 [3] Biank, M.: “Methodology, Implementation and Validation of a Variable Scale Simulation Model for Windpower based on the Georeferenced Installation Register of Germany”. Master’s Thesis at Reiner Lemoine Institute, 2014, p. 13