SPDX-FileCopyrightText: 2019 oemof developer group contact@oemof.org
SPDX-License-Identifier: MIT
SPDX-License-Identifier: CC-BY-4.0
TurbineClusterModelChain example
This example shows you how to calculate the power output of wind farms and wind turbine clusters using the windpowerlib. A cluster can be useful if you want to calculate the feed-in of a region for which you want to use one single weather data point.
Functions that are used in the ModelChain example, like the initialization of wind turbines, are imported and used without further explanation.
Imports and initialization of wind turbines
The import of weather data and the initialization of wind turbines are taken from the modelchain_example. See there for more information.
Also, be aware that currently for wind farm and wind cluster calculations wind turbines need to have a power curve as some calculations do not work with the power coefficient curve.
[1]:
import os
import pandas as pd
import requests

from windpowerlib import create_power_curve, TurbineClusterModelChain, WindFarm, WindTurbine, WindTurbineCluster

import logging
logging.getLogger().setLevel(logging.DEBUG)
[2]:
def get_weather_data(filename='weather.csv', **kwargs):
    r"""
    Imports weather data from a file.

    """

    if 'datapath' not in kwargs:
        kwargs['datapath'] = os.path.dirname(__file__)

    file = os.path.join(kwargs['datapath'], filename)

    # download example weather data file in case it does not yet exist
    if not os.path.isfile(file):
        logging.debug("Download weather data for example.")
        req = requests.get("https://osf.io/59bqn/download")
        with open(file, "wb") as fout:
            fout.write(req.content)

    # read csv file
    weather_df = pd.read_csv(
        file,
        index_col=0,
        header=[0, 1],
    )
    weather_df.index = pd.to_datetime(weather_df.index, utc=True)

    # change time zone
    weather_df.index = weather_df.index.tz_convert(
        'Europe/Berlin')

    return weather_df

# Read weather data from csv
weather = get_weather_data(filename='weather.csv', datapath='')
print(weather[['wind_speed', 'temperature', 'pressure']][0:3])
variable_name             wind_speed          temperature         pressure
height                            10       80           2      10        0
2010-01-01 00:00:00+01:00    5.32697  7.80697      267.60  267.57  98405.7
2010-01-01 01:00:00+01:00    5.46199  7.86199      267.60  267.55  98382.7
2010-01-01 02:00:00+01:00    5.67899  8.59899      267.61  267.54  98362.9
[3]:
def initialize_wind_turbines():
    r"""
    Initializes three WindTurbine objects.

    """
    enercon_e126 = {
        "turbine_type": "E-126/4200",  # turbine type as in register
        "hub_height": 135,  # in m
    }
    e126 = WindTurbine(**enercon_e126)

    my_turbine = {
        "nominal_power": 3e6,  # in W
        "hub_height": 105,  # in m
        "power_curve": pd.DataFrame(
            data={
                "value": [
                    p * 1000
                    for p in [0.0, 26.0, 180.0, 1500.0, 3000.0, 3000.0]
                ],  # in W
                "wind_speed": [0.0, 3.0, 5.0, 10.0, 15.0, 25.0],
            }
        ),  # in m/s
    }
    my_turbine = WindTurbine(**my_turbine)

    my_power = pd.Series(
        [0.0, 39000.0, 270000.0, 2250000.0, 4500000.0, 4500000.0]
    )
    my_wind_speed = (0.0, 3.0, 5.0, 10.0, 15.0, 25.0)

    my_turbine2 = {
        "nominal_power": 6e6,  # in W
        "hub_height": 115,  # in m
        "power_curve": create_power_curve(
            wind_speed=my_wind_speed, power=my_power
        ),
    }
    my_turbine2 = WindTurbine(**my_turbine2)

    return my_turbine, e126, my_turbine2

my_turbine, e126, my_turbine2 = initialize_wind_turbines()
print('Nominal power of my_turbine: {}'.format(my_turbine.nominal_power))
Nominal power of my_turbine: 3000000.0
Initialize wind farm
To initialize a specific wind farm you need to provide a wind turbine fleet specifying the wind turbines and their number or total installed capacity (in Watt) in the farm. Optionally, you can specify a wind farm efficiency and a name as an identifier.
[3]:
# specification of wind farm data where turbine fleet is provided in a
# pandas.DataFrame
# for each turbine type you can either specify the number of turbines of
# that type in the wind farm (float values are possible as well) or the
# total installed capacity of that turbine type in W
wind_turbine_fleet = pd.DataFrame(
        {'wind_turbine': [my_turbine, e126],  # as windpowerlib.WindTurbine
         'number_of_turbines': [6, None],
         'total_capacity': [None, 12.6e6]}
    )
# initialize WindFarm object
example_farm = WindFarm(name='example_farm',
                        wind_turbine_fleet=wind_turbine_fleet)
Following, a wind farm with a constant efficiency is defined. A wind farm efficiency can also be dependent on the wind speed in which case it needs to be provided as a dataframe with ‘wind_speed’ and ‘efficiency’ columns containing wind speeds in m/s and the corresponding dimensionless wind farm efficiency.
[4]:
# specification of wind farm data (2) containing a wind farm efficiency
# wind turbine fleet is provided using the to_group function
example_farm_2_data = {
    'name': 'example_farm_2',
    'wind_turbine_fleet': [my_turbine.to_group(6),
                           e126.to_group(total_capacity=12.6e6)],
    'efficiency': 0.9}

# initialize WindFarm object
example_farm_2 = WindFarm(**example_farm_2_data)

print('nominal power of first turbine type of example_farm_2: {}'.format(
    example_farm_2.wind_turbine_fleet.loc[0, 'wind_turbine'].nominal_power))
nominal power of first turbine type of example_farm_2: 3000000.0
Initialize wind turbine cluster
Like for a wind farm for the initialization of a wind turbine cluster you can use a dictionary that contains the basic parameters. A wind turbine cluster is defined by its wind farms.
[5]:
# specification of cluster data
example_cluster_data = {
    'name': 'example_cluster',
    'wind_farms': [example_farm, example_farm_2]}

# initialize WindTurbineCluster object
example_cluster = WindTurbineCluster(**example_cluster_data)
Use the TurbineClusterModelChain to calculate power output
The TurbineClusterModelChain is a class that provides all necessary steps to calculate the power output of a wind farm or wind turbine cluster.
Like the ModelChain (see basic example) you can use the TurbineClusterModelChain with default parameters as shown in this example for the wind farm or specify custom parameters as done here for the cluster. If you use the ‘run_model’ method first the aggregated power curve and the mean hub height of the wind farm/cluster is calculated, then inherited functions of the ModelChain are used to calculate the wind speed and density (if necessary) at hub height. After that, depending on the parameters, wake losses are applied and at last the power output is calculated.
[6]:
# power output calculation for example_farm
# initialize TurbineClusterModelChain with default parameters and use
# run_model method to calculate power output
mc_example_farm = TurbineClusterModelChain(example_farm).run_model(weather)
# write power output time series to WindFarm object
example_farm.power_output = mc_example_farm.power_output
DEBUG:root:Wake losses considered by dena_mean wind efficiency curve.
DEBUG:root:Aggregated power curve not smoothed.
DEBUG:root:Calculating wind speed using logarithmic wind profile.
DEBUG:root:Calculating power output using power curve.
[7]:
# set efficiency of example_farm to apply wake losses
example_farm.efficiency = 0.9

# power output calculation for turbine_cluster
# own specifications for TurbineClusterModelChain setup
modelchain_data = {
        'wake_losses_model': 'wind_farm_efficiency',  #
                                           # 'dena_mean' (default), None,
                                           # 'wind_farm_efficiency' or name
                                           #  of another wind efficiency curve
                #  see :py:func:`~.wake_losses.get_wind_efficiency_curve`
        'smoothing': True,  # False (default) or True
        'block_width': 0.5,  # default: 0.5
        'standard_deviation_method': 'Staffell_Pfenninger',  #
                                            # 'turbulence_intensity' (default)
                                            # or 'Staffell_Pfenninger'
        'smoothing_order': 'wind_farm_power_curves',  #
                                        # 'wind_farm_power_curves' (default) or
                                        # 'turbine_power_curves'
        'wind_speed_model': 'logarithmic',  # 'logarithmic' (default),
                                            # 'hellman' or
                                            # 'interpolation_extrapolation'
        'density_model': 'ideal_gas',  # 'barometric' (default), 'ideal_gas' or
                                       # 'interpolation_extrapolation'
        'temperature_model': 'linear_gradient',  # 'linear_gradient' (def.) or
                                                 # 'interpolation_extrapolation'
        'power_output_model': 'power_curve',  # 'power_curve' (default) or
                                              # 'power_coefficient_curve'
        'density_correction': True,  # False (default) or True
        'obstacle_height': 0,  # default: 0
        'hellman_exp': None}  # None (default) or None

# initialize TurbineClusterModelChain with own specifications and use
# run_model method to calculate power output
mc_example_cluster = TurbineClusterModelChain(
        example_cluster, **modelchain_data).run_model(weather)
# write power output time series to WindTurbineCluster object
example_cluster.power_output = mc_example_cluster.power_output
DEBUG:root:Wake losses considered with wind_farm_efficiency.
DEBUG:root:Aggregated power curve smoothed by method: Staffell_Pfenninger
DEBUG:root:Calculating wind speed using logarithmic wind profile.
DEBUG:root:Calculating temperature using temperature gradient.
DEBUG:root:Calculating density using ideal gas equation.
DEBUG:root:Calculating power output using power curve.
Plot results
If you have matplotlib installed you can visualize the calculated power output.
[8]:
# try to import matplotlib
logging.getLogger().setLevel(logging.WARNING)
try:
    from matplotlib import pyplot as plt
    # matplotlib inline needed in notebook to plot inline
    %matplotlib inline
except ImportError:
    plt = None
[9]:
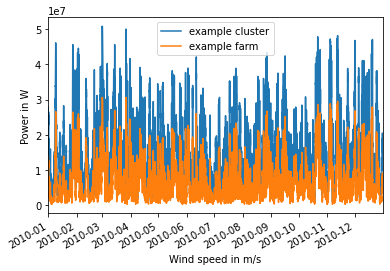
# plot turbine power output
if plt:
    example_cluster.power_output.plot(legend=True, label='example cluster')
    example_farm.power_output.plot(legend=True, label='example farm')
    plt.xlabel('Wind speed in m/s')
    plt.ylabel('Power in W')
    plt.show()
[10]:
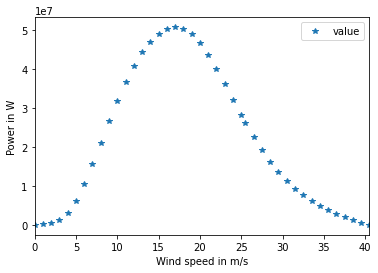
# plot aggregated (and smoothed) power curve of example_cluster
if plt:
    example_cluster.power_curve.plot(
        x='wind_speed', y='value', style='*')
    plt.xlabel('Wind speed in m/s')
    plt.ylabel('Power in W')
    plt.show()
[ ]: